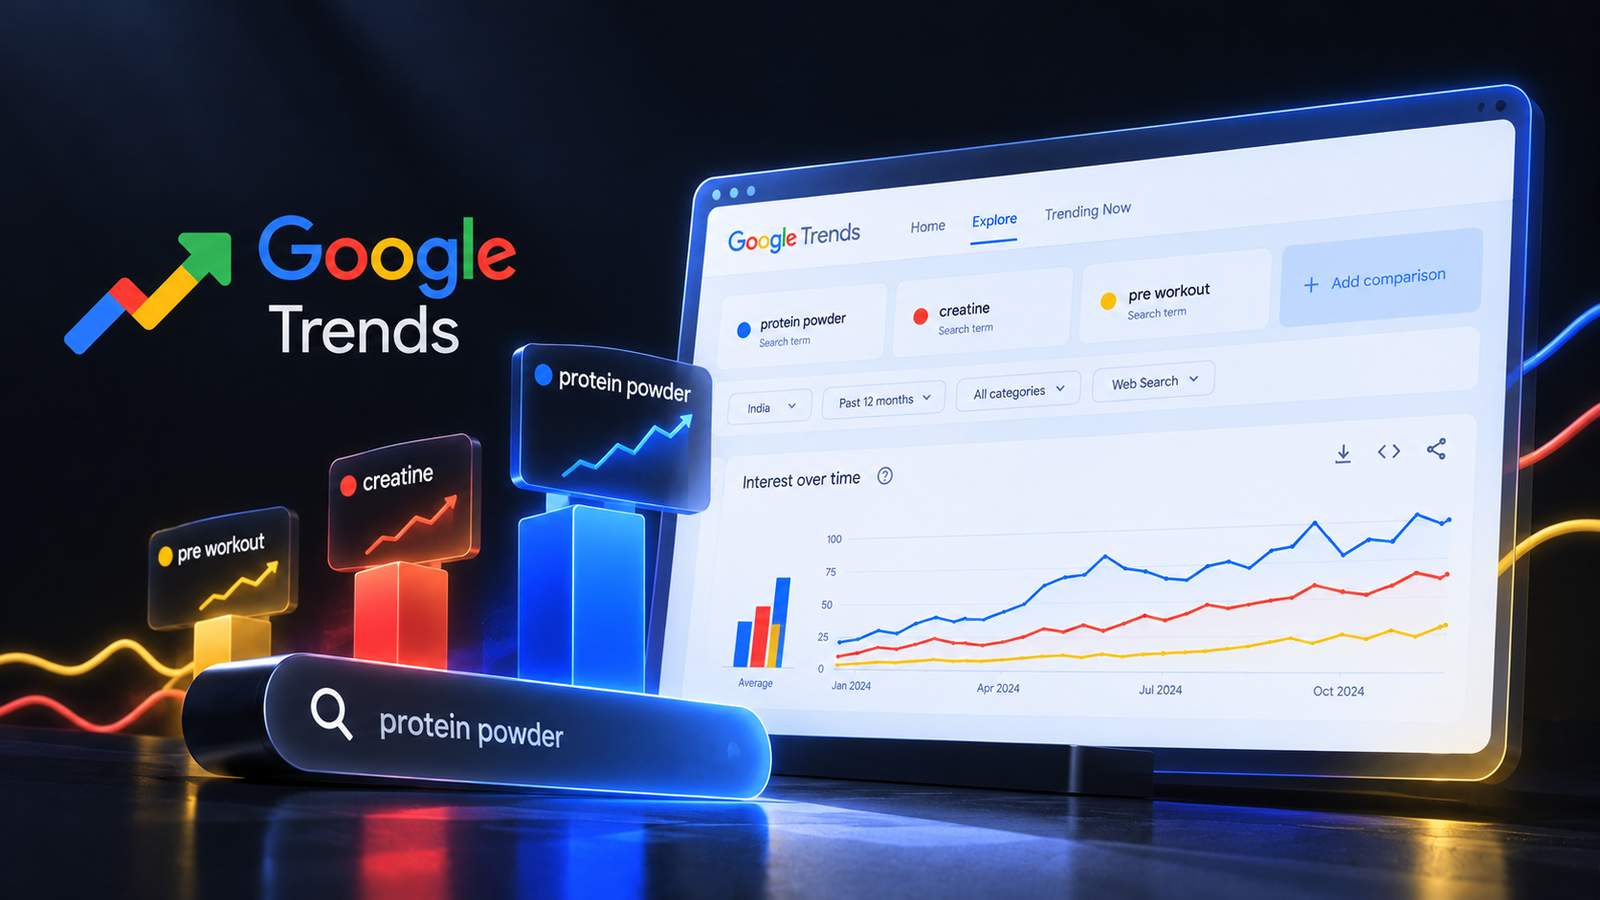
Google Trends is a free tool from Google that shows how interest in a search term changes over time and across places. It uses a 0 to 100 scale to show relative popularity, not exact search numbers. Marketers use Google Trends for marketing research, content timing, product launches, regional campaigns and spotting rising topics early.
Internet Culture · Stacks · 003
The stack card
| What it does | Shows what people search, where, and when |
| Cost | Free |
| Best for | Marketers, founders, content teams, students |
| Setup time | None. Open it and type. |
| Works with | Your browser, plus Google Search, YouTube, Shopping and News data |
| Skill needed | Low. Reading it well takes a little practice. |
1 The room
A team is planning a winter skincare campaign. The plan says launch nationally on 1 November.
Someone opens Google Trends and types “dry skin”. The line starts climbing weeks earlier in North India. It barely moves in Chennai. In Delhi, interest peaks around December and January.
The team changes two things. They launch earlier in the North and skip the South for this campaign.
Nobody bought a research report. Nobody ran a survey. They just looked at what people were already telling Google.
2 What is Google Trends?
Google Trends is a free website from Google that shows how often people search for a topic, compared to all searches at that time and place.
The important thing to understand: Google Trends doesn’t show exact search volumes. It shows a score from 0 to 100. 100 means the term was at its most popular for that time and place. 50 means half as popular. It’s a relative scale, not a count.
That sounds like a weakness. It’s actually what makes the tool useful. You’re not asking “how many people searched?” You’re asking “when, where and how is interest changing?”
3 How to use Google Trends: the 7 features that matter
01. Interest over time. Type a term and see its line over days, months or years. You’ll spot seasons, spikes and slow declines. “Sunscreen” rises every summer. “Raincoat” rises with the monsoon. Your category has a rhythm too.
02. Compare up to five terms. Add more search terms to see them on one chart. Useful for picking words. Do people search “face wash” or “facewash”? “Running shoes” or “sports shoes”? Write in the words people actually use.
03. Interest by region. See which Indian states, and sometimes cities, search a term most. This is search trends India data you can use straight away for regional ads, language choices and launch order.
04. Related queries: Top and Rising. Below every chart, Google Trends lists searches connected to your term. “Top” shows the most common. “Rising” shows the ones growing fastest. A term marked “Breakout” has grown sharply. This is where the best content and product ideas hide.
05. Change the search type. By default you see Web Search. You can switch to YouTube Search, Google Shopping, Image or News. If you make videos, check YouTube. If you sell products, check Shopping.
06. Pick the right time range. Past 5 years shows long trends and seasons. Past 12 months is good for planning. Past 7 days or past day shows what’s spiking right now. Changing the range can completely change what you see.
07. Trending Now. This shows what’s suddenly popular in searches in India right now. It’s useful for moment marketing, quick social posts and reacting to news while it’s still fresh.
THE RISING NOT RICH RULE
The biggest searches are already crowded. The rising ones are where the opportunity is. In Google Trends, read the Rising list before the Top list.
Rule 1. Top tells you what’s established. Useful for understanding the market, but everyone else is already writing about it.
Rule 2. Rising tells you what’s coming. Get there early and you face less competition in search, social and ads.
Rule 3. Check that rising isn’t just a spike. Look at the five-year view. A real trend keeps growing. A spike falls back to normal in a week.
4 Who gets the most out of Google Trends?
Content and SEO teams. Pick topics people are increasingly searching for, and time posts to go live just before interest peaks. It’s a simple layer of keyword research that costs nothing.
Performance marketers. Shift budget towards states and months where interest is highest. Raise bids ahead of seasonal peaks, not after them.
Founders and product teams. Check whether interest in a category is growing before you build for it. A slow, steady rise over five years is a much better sign than a one-month spike.
Brand teams. Compare your brand name’s search interest over time and across regions. If brand searches rise after a campaign in one state, that campaign is probably working there.
Students and job seekers. Walk into an interview with a chart showing how interest in the company’s category has changed. It shows you did more homework than everyone else.
5 How to use Google Trends in 10 minutes
- Go to the Google Trends website. No login needed.
- Type a search term into the Explore box.
- Set the location to India, or a specific state.
- Choose a time range. Start with Past 5 years to see seasons.
- Add up to four comparison terms to check wording.
- Scroll down to Interest by subregion to see which states care most.
- Scroll to Related queries and switch to Rising.
- Change the search type to YouTube or Shopping if that’s where your audience is.
- Click the download icon on any chart to save the data as a file for your reports.
6 What Google Trends will not do
It won’t tell you exact search volumes. The 0 to 100 scale is relative. For estimated monthly numbers, you’ll need a separate keyword tool.
It won’t show much for very rare terms. If too few people search something, the chart may show nothing at all.
It won’t tell you why interest changed. A spike could be a news story, a viral post or a celebrity mention. You’ll need to look around to find out.
It won’t predict the future. It shows patterns from the past. Seasons tend to repeat, but nothing is guaranteed.
7 Steal this: your first week with Google Trends
01. Search your main product category. Set India and Past 5 years. Write down the months it peaks.
02. Compare three ways people might describe your product. Use the winning words in your next ad and landing page.
03. Check Interest by subregion. Note your top five states. Do your ad budgets match?
04. Open Related queries, switch to Rising, and write down five new content ideas.
05. Search your brand name. Check whether interest went up after your last big campaign.
06. Set a calendar reminder to check your category’s peak season six weeks before it arrives next year.
8 Frequently asked questions
What is Google Trends used for?
Google Trends is used to see how interest in a search term changes over time and across locations. Marketers use it for content planning, keyword choices, seasonal campaign timing, regional targeting, and spotting rising topics early.
Does Google Trends show search volume?
No. Google Trends shows relative interest on a scale from 0 to 100, where 100 is the peak popularity for the chosen time and place. It does not show the exact number of searches.
How do I use Google Trends for marketing?
Use Google Trends for marketing by checking when your category peaks, which regions search for it most, which words people use, and which related searches are rising. Then time your campaigns, adjust regional budgets and write content around rising topics.
Is Google Trends free?
Yes. Google Trends is completely free and does not require an account to use.
What does “Breakout” mean in Google Trends?
“Breakout” in the Related queries section means a search term has grown sharply in a short period, often by a very large percentage. It usually points to an emerging topic worth watching.