A falling retention curve can make your ad account look like the obvious place to work. Usually, it is the wrong place to start. First find out when customers leave and what the customers who stay do differently.
Summary
A retention curve shows how many customers from a group continue to return or use a product over time. A downward slope is normal. What matters is how quickly customers leave, whether the curve eventually levels out, and how its shape changes between customer groups. If new customers leave at the same point, buying more traffic may simply give you more people who leave.
Internet Culture · Playbook · Growth 004
Helps you decide: whether to spend more on acquisition, investigate retention, or do both at the same time.
Why this is worth ten minutes
- A falling line is not automatically a crisis. Every business loses some customers. The shape and timing of that loss matter more than the fact that it happens.
- Looking at one retention number can hide the problem. Customers from different channels, offers and use cases may behave very differently.
- More advertising can increase new customer numbers while making the underlying problem more expensive.
- Retention analysis is not about forcing every customer to stay. It is about finding which customers get lasting value, and why.
1 The room
Imagine a Monday growth review. New customers are up. The paid team has found a campaign that brings in signups at a cost the company can afford.
Someone opens the retention report. The line falls sharply after the first week.
The first suggestion is predictable: buy more traffic. If the campaign is working, more customers should mean more growth.
Maybe. But if the new customers disappear at the same point as the old ones, the campaign has only made the leak larger. The business is paying to refill a bucket before checking why the water is running out.
The chart is not saying “stop marketing.” It is asking a more useful question: what happens between the first moment of value and the moment the customer leaves?
2 What does a retention curve tell you?
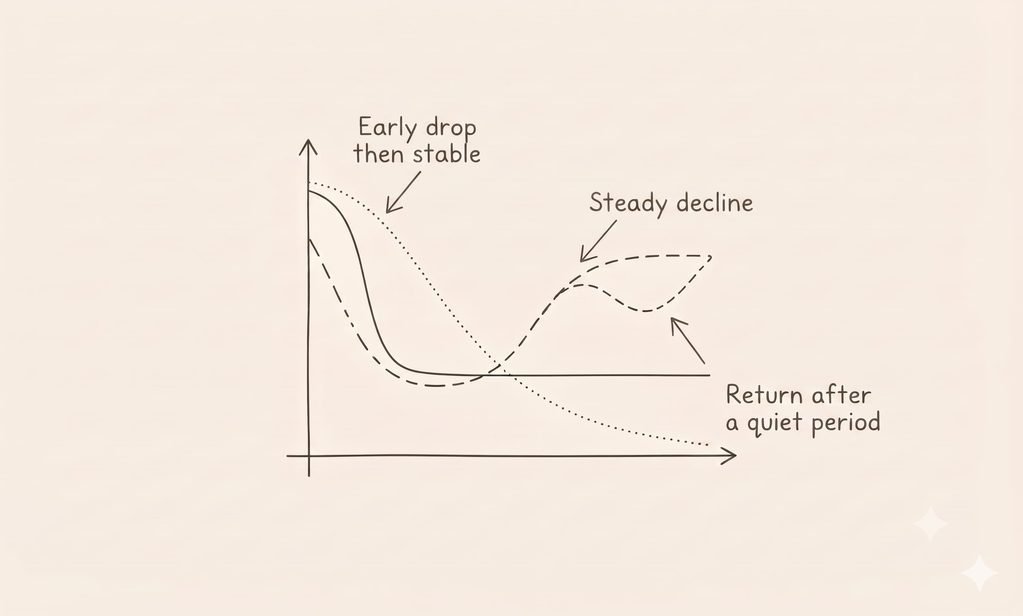
A retention curve tracks a group of customers over time. That group is usually called a cohort. It might be people who signed up in the same week, placed their first order in the same month, or arrived through the same campaign.
At each point, you measure how many members of the cohort have returned or remain active. The exact definition depends on the business.
For a subscription product, retention might mean a customer still has a paid subscription. For a food app, it might mean placing another order. For a work tool, it might mean using a meaningful feature again. A login by itself may not count as useful activity.
The important part is to define retention before you read the curve. If “active customer” changes from report to report, the line may look different without customer behaviour changing at all.
Retention tools also use different views. Some measure whether a customer returned on a specific day. Others count a customer as retained if they came back on that day or any day after it. Amplitude’s retention analysis documentation explains how the chosen retention view changes what you see.
There is no single retention curve that every business should copy. A customer buying a mattress is not expected to return every week. A customer using a daily messaging app might be. A subscription renews on a schedule. A grocery order happens when the household runs out.
The curve only makes sense in relation to the behaviour the product is meant to create.
3 How should you read a falling retention curve?
Start with the shape, not the benchmark.
| What the curve looks like | What it might mean | What to investigate |
|---|---|---|
| A sharp early drop, then it levels out | Some customers try the product and leave. A smaller group continues. | Whether the people who stay reach value sooner or use a particular feature |
| A steady decline towards zero | Customers are not forming a lasting pattern of use. | Product value, customer expectations, use case and first experience |
| A flat line from the beginning | Retention may be stable, or the metric may be too broad to reveal meaningful behaviour. | Whether “active” means the customer received real value |
| A dip followed by a rise | Customers may return around a seasonal, monthly or occasional need. | Purchase cycles, reminders, billing periods and category frequency |
A curve that falls before it levels out can still describe a healthy business. The flat part may represent the customers who find lasting value. But if the curve keeps falling to almost no returning customers, the business should understand why before treating acquisition as the only growth lever.
The Mixpanel guide to retention reports is useful for seeing how cohorts and return behaviour can be separated. Use the tool that fits your data. The central point is the same: compare groups whose behaviour can reasonably be compared.
THE NEXT-COHORT TEST
Before increasing acquisition spend, compare the curve for your newest customer group with the curve for the group before it.
Ask three questions:
Same definition? Did both groups have the same opportunity to return, measured in the same way?
Same shape? Do they leave at the same point, or is the newer group behaving differently?
Same customer? Did both groups arrive through similar channels, offers, locations and use cases?
If the curves are comparable and the same drop-off keeps appearing, investigate that moment before assuming the answer is more traffic.
A curve is a clue about behaviour. It is not an explanation by itself.
4 Why more ads can make a retention problem more expensive
01. Ads bring people in. They do not decide whether the product remains useful. Advertising can create awareness, set expectations and help someone try a product. The experience after that first try determines whether the customer has a reason to return.
02. A channel can attract the wrong kind of customer for your economics. A heavy discount may bring in buyers who only wanted that offer. A broad campaign may reach people with a different need from the one your product serves best. Compare retention by source and offer, not only by the cost of the first purchase.
03. Averages hide the people who stay. One average retention rate can combine frequent users, occasional buyers, high-value customers and people who leave after one visit. Segmenting cohorts can reveal whether one group is finding value while another is not.
04. The first use may be the real drop-off point. Customers often leave because they never reach the part of the product that makes the promise real. They signed up, placed an order or opened the app, but never got the result they expected. This connects to the growth loops versus funnels article, where retention is the condition that lets a growth system keep working.
05. Retention and acquisition are connected. A better first experience can make future acquisition more valuable. Clear expectations, useful onboarding and a reason to return can help customers stay. They do not replace acquisition, but they can improve what the business gets from it. See also how productive friction can increase customer investment.
06. A channel can look efficient because it borrows from the future. A campaign may bring forward purchases that customers would otherwise have made later. Watch repeat orders and contribution over time, not only first-order revenue. Our piece on why acquisition channels get more expensive explains why a channel’s short-term results can hide a longer-term weakness.
5 The counter-weight
A falling retention curve does not always mean the product is failing. Some products are bought rarely. Some customers return only when a seasonal or life-stage need appears. A short measurement window can make a normal buying cycle look like churn.
New products need time. A recent launch may not yet have enough history to show a stable pattern. Do not treat early data as a mature benchmark.
A curve can be misleading if the event is poorly defined. Counting any app open as retention can make the report look healthier than the customer relationship is. Count behaviour that shows the customer received value.
Acquisition does not always need to stop. A business may have a strong, profitable channel while it improves retention. The practical question is whether additional spend is worth the likely return, given what you currently know about customer behaviour.
A retention graph cannot tell you why someone left. It shows when behaviour changed. Customer interviews, support conversations, product analytics and order history can help explain what happened. The curve points to the question. It does not answer it alone.
Internet Culture verdict desk
A falling retention curve does not tell you to stop acquiring customers. It tells you to check what happens after they arrive.
6 Steal this
01. Write down your exact definition of a retained customer. If the team cannot agree on it, fix the definition before debating the result.
02. Compare at least three cohorts using the same time window and the same retention event.
03. Break retention out by channel, first offer, customer type and use case. Look for groups that behave differently.
04. Find the first point where the curve changes sharply. Check what customers were doing immediately before they stopped returning.
05. Interview customers who left and customers who stayed. Ask what happened between the first use and the decision to return, or not.
06. Before scaling a campaign, estimate the value of the customer group it brings in over time. First purchases alone do not show whether the spend is working.
7 Frequently asked questions
What is a retention curve?
A retention curve shows how many customers from a cohort continue to return or use a product over time. It helps a team see when customers leave and whether a group of customers continues to receive value.
Is a falling retention curve always bad?
No. Some customer loss is normal, and some products are used or bought only occasionally. The important questions are how quickly the curve falls, whether it levels out, and whether it matches the natural use or purchase cycle of the product.
What does it mean if a retention curve levels off?
A curve that levels off may show that a smaller group of customers continues using the product. Check that the event being measured reflects real value, then examine who those customers are and how they differ from people who left.
Should I stop advertising if customer retention is falling?
Not automatically. If an acquisition channel brings profitable customers, it may still make sense to keep using it while investigating retention. Before increasing spend, check whether new customers return, when they leave and how much value they create over time.
How do I improve customer retention?
First identify when customers stop returning and which groups are most affected. Then investigate onboarding, expectations, product usefulness, purchase timing and support. A retention curve points to the problem area. Customer research and product data help explain the cause.